The Nugget Creek fire, and how fires are managed in Alaska

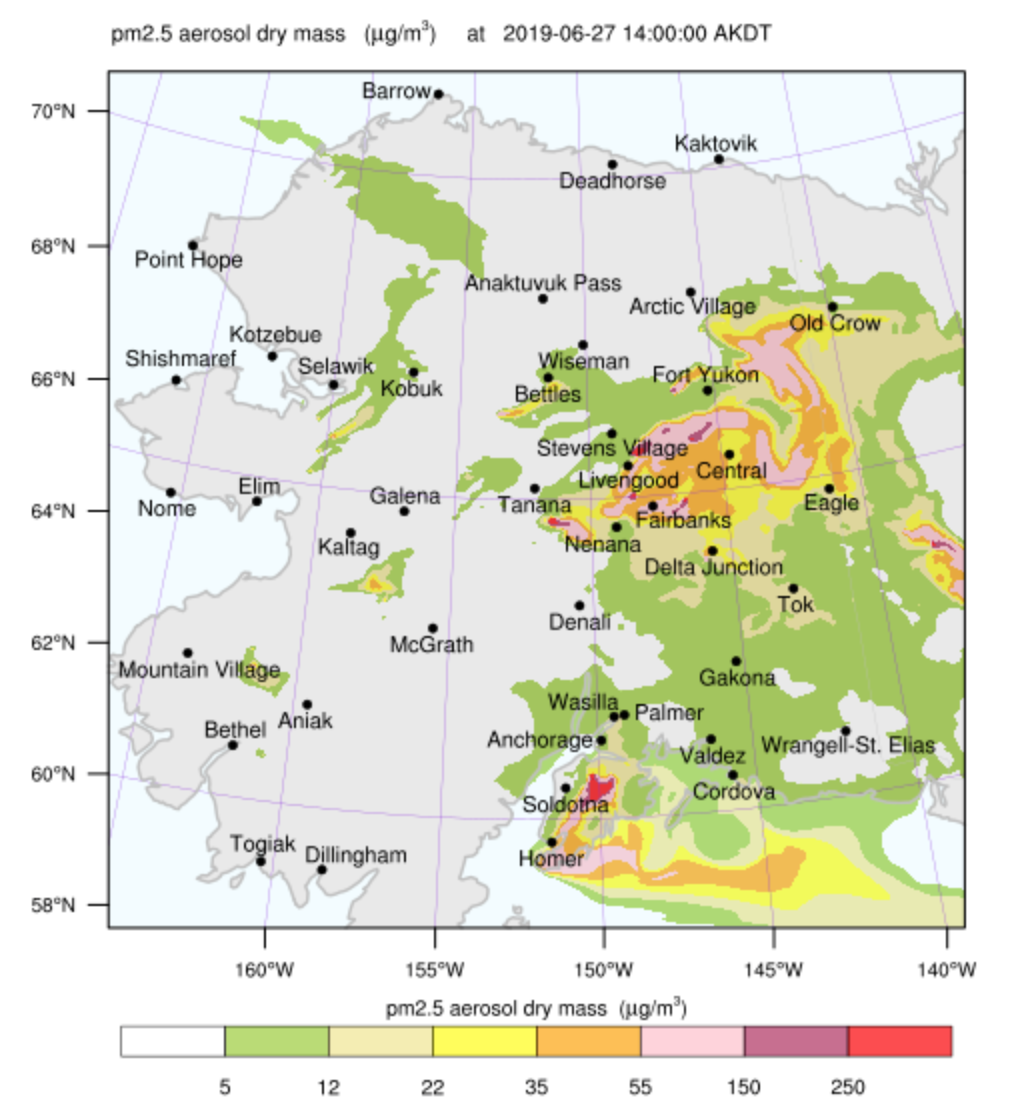
The numerous wildfires currently active in interior Alaska have made it a pretty miserable last day of the holiday weekend (Independence Day was Thursday in the US). The Fairbanks area is blanketed in smoke so badly that there’s a dense smoke advisory in effect and the local hospital has set up a smoke respite room for people with respiratory issues.

Most eyes are on the Shovel Creek fire NW of Fairbanks, which is burning very close to residential neighborhoods in mature black spruce forest, which naturally burns every ~100 years or so (plus/minus a large interval). It is managed by a Type 1 team – these are nationally managed in the US, and have the largest amount of experience and resources. There have been regular public information meetings, and the fire even has its own YouTube channel.

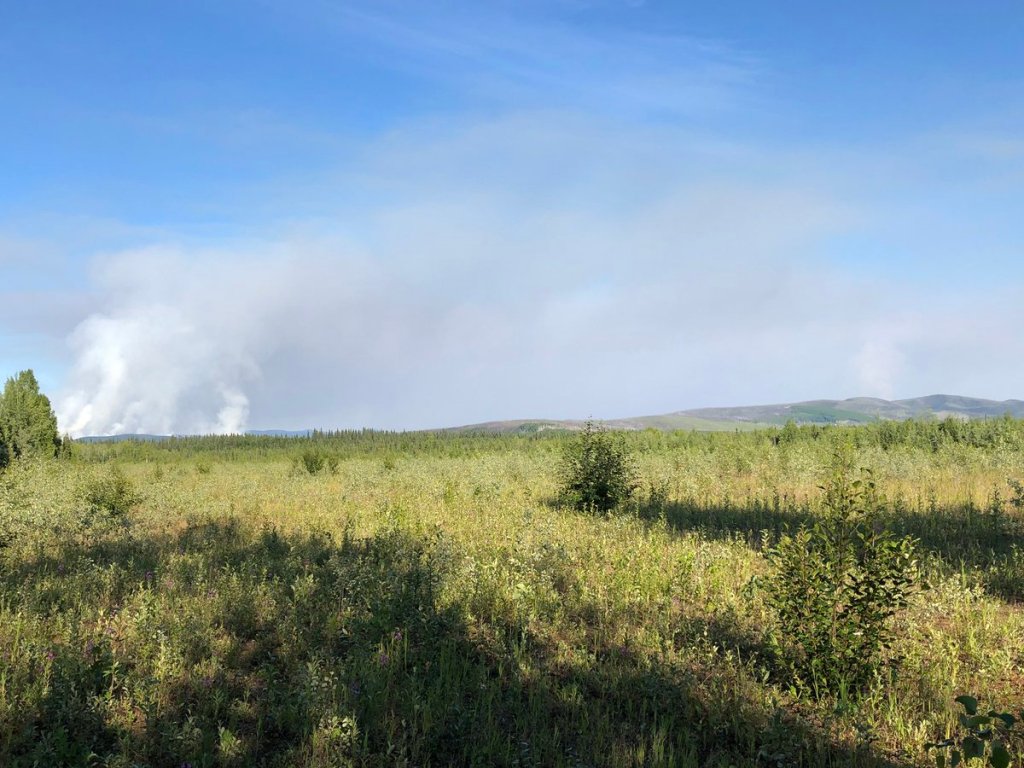
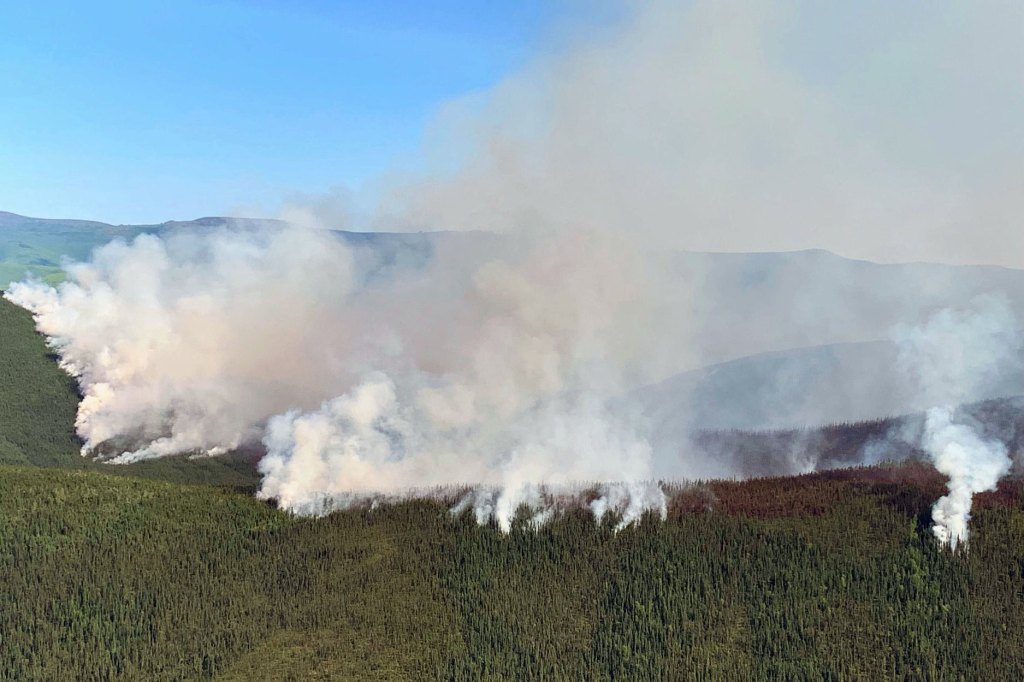
I live about 30 miles east of town, and over here, even though smoke these days comes from any of multiple fires in the wider area, the one we’re most concerned with is the Nugget Creek fire. It’s roughly the same order of magnitude as the Shovel Creek fire (a little smaller – 7000 acres / 2800 ha as of today, and growing – but unlike its companion, has not received any suppression activity at all, even though it’s only about 10 miles (16 km) from a residential area.

Why? This has to do with how decisions about fire management are made in Alaska. All of Alaska is divided into one of four fire management options. If you follow the link you’ll see that most of the remote areas are in the “limited” option. Here, fire is by default allowed to fulfill its natural ecological function, though known cabins and infrastructure is being protected by firefighters on the ground and from planes. Also, reconnaissance flights are being carried out, and fires are monitored. On the other extreme is the “critical” management option, where all fires are immediately suppressed. Towns and villages are covered by these. In-between, there are two intermediate options, “full” (covering the major road corridors, mining areas etc.) and “modified”. (These options are used for prioritization – there is no mechanical

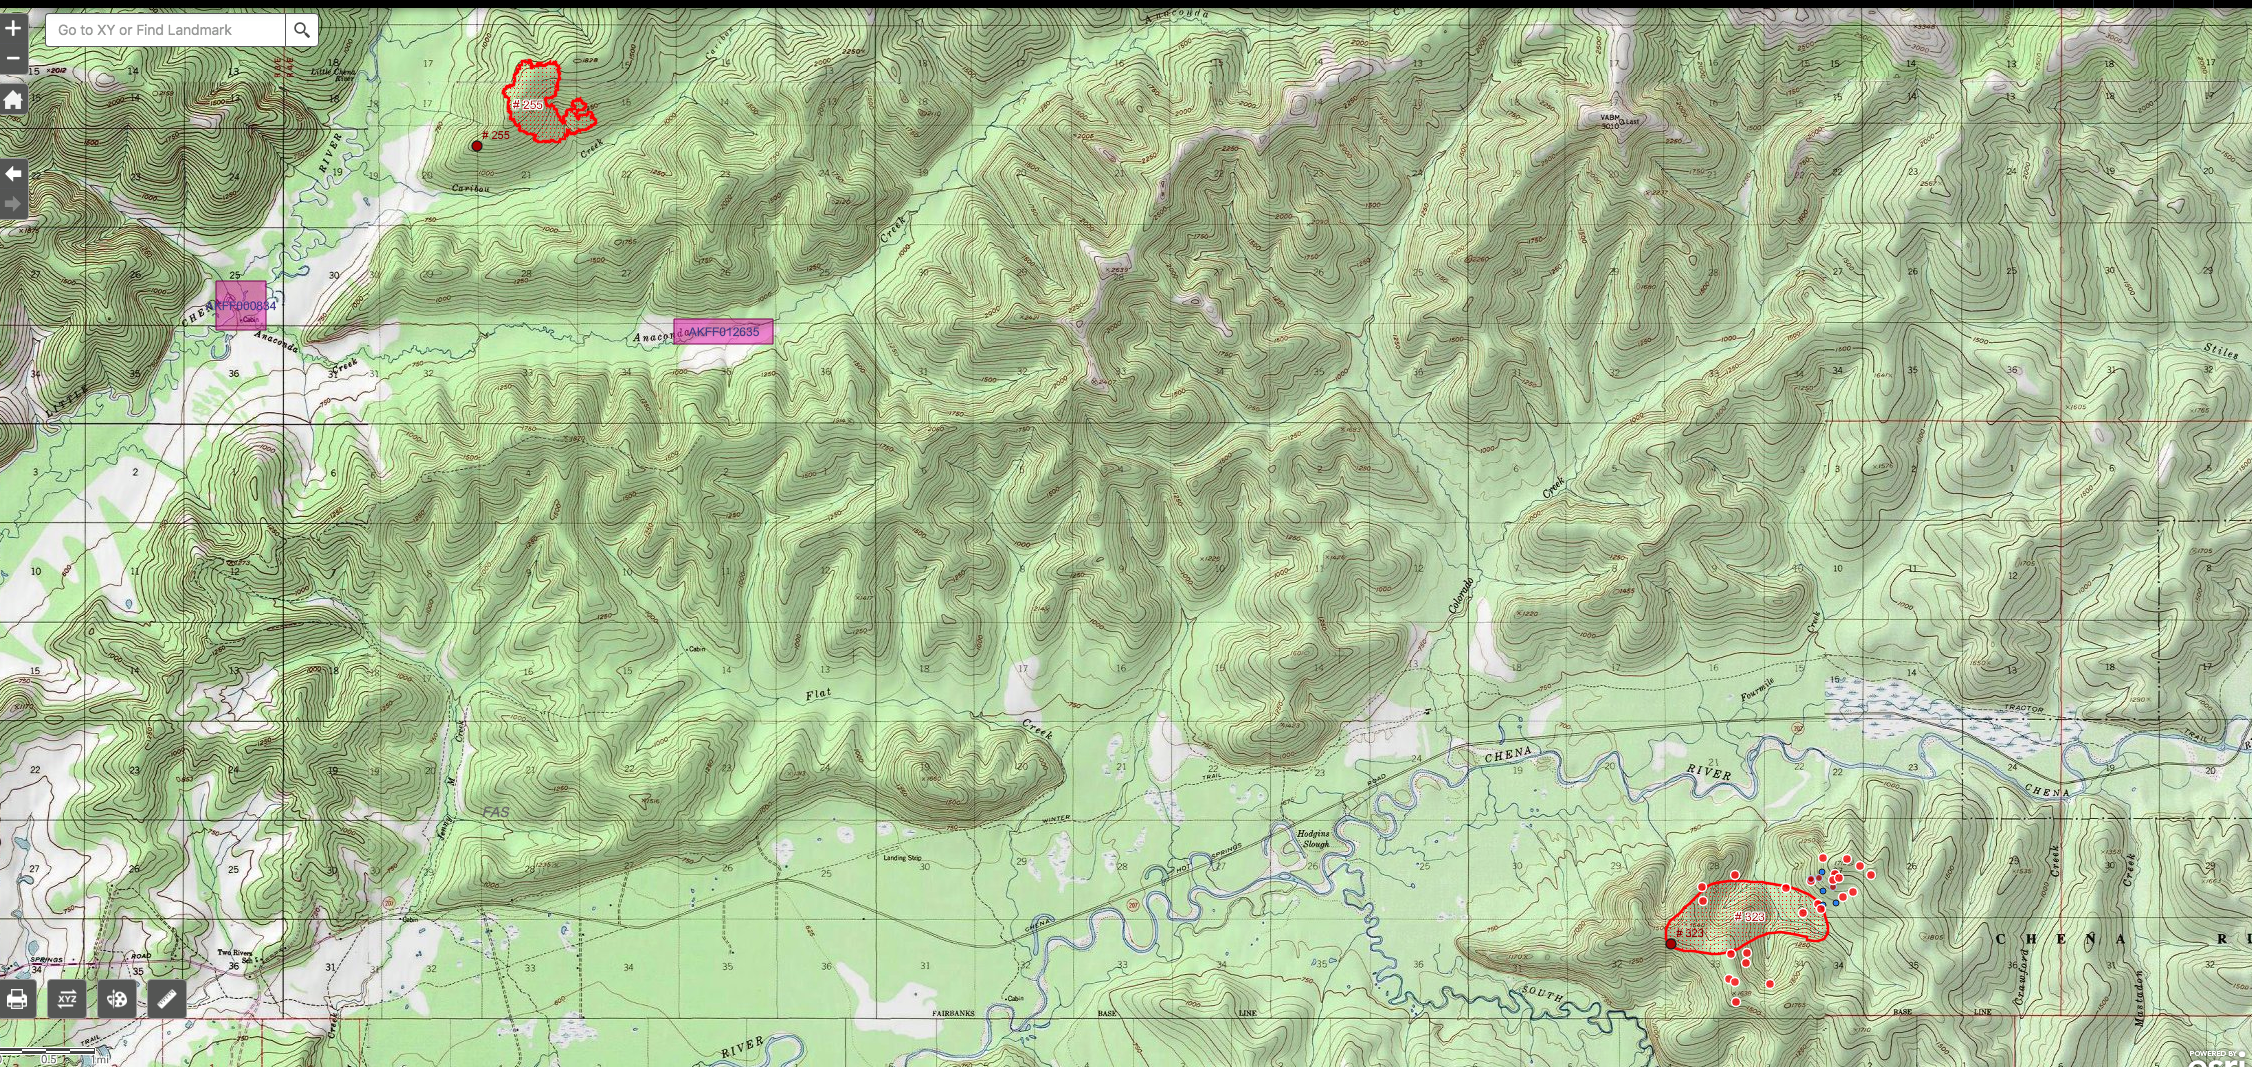
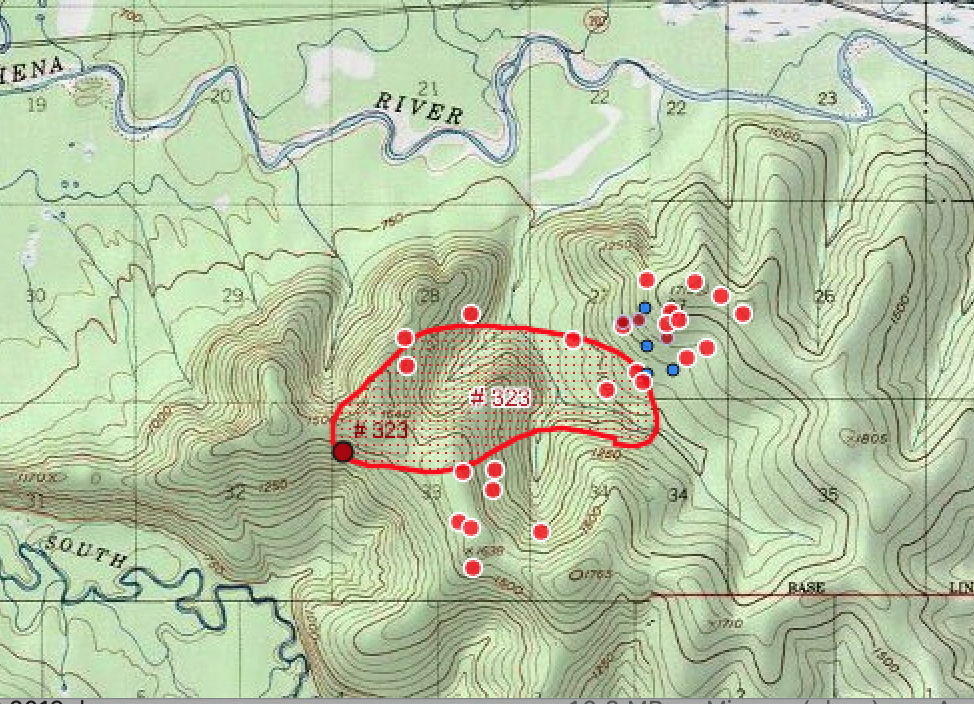
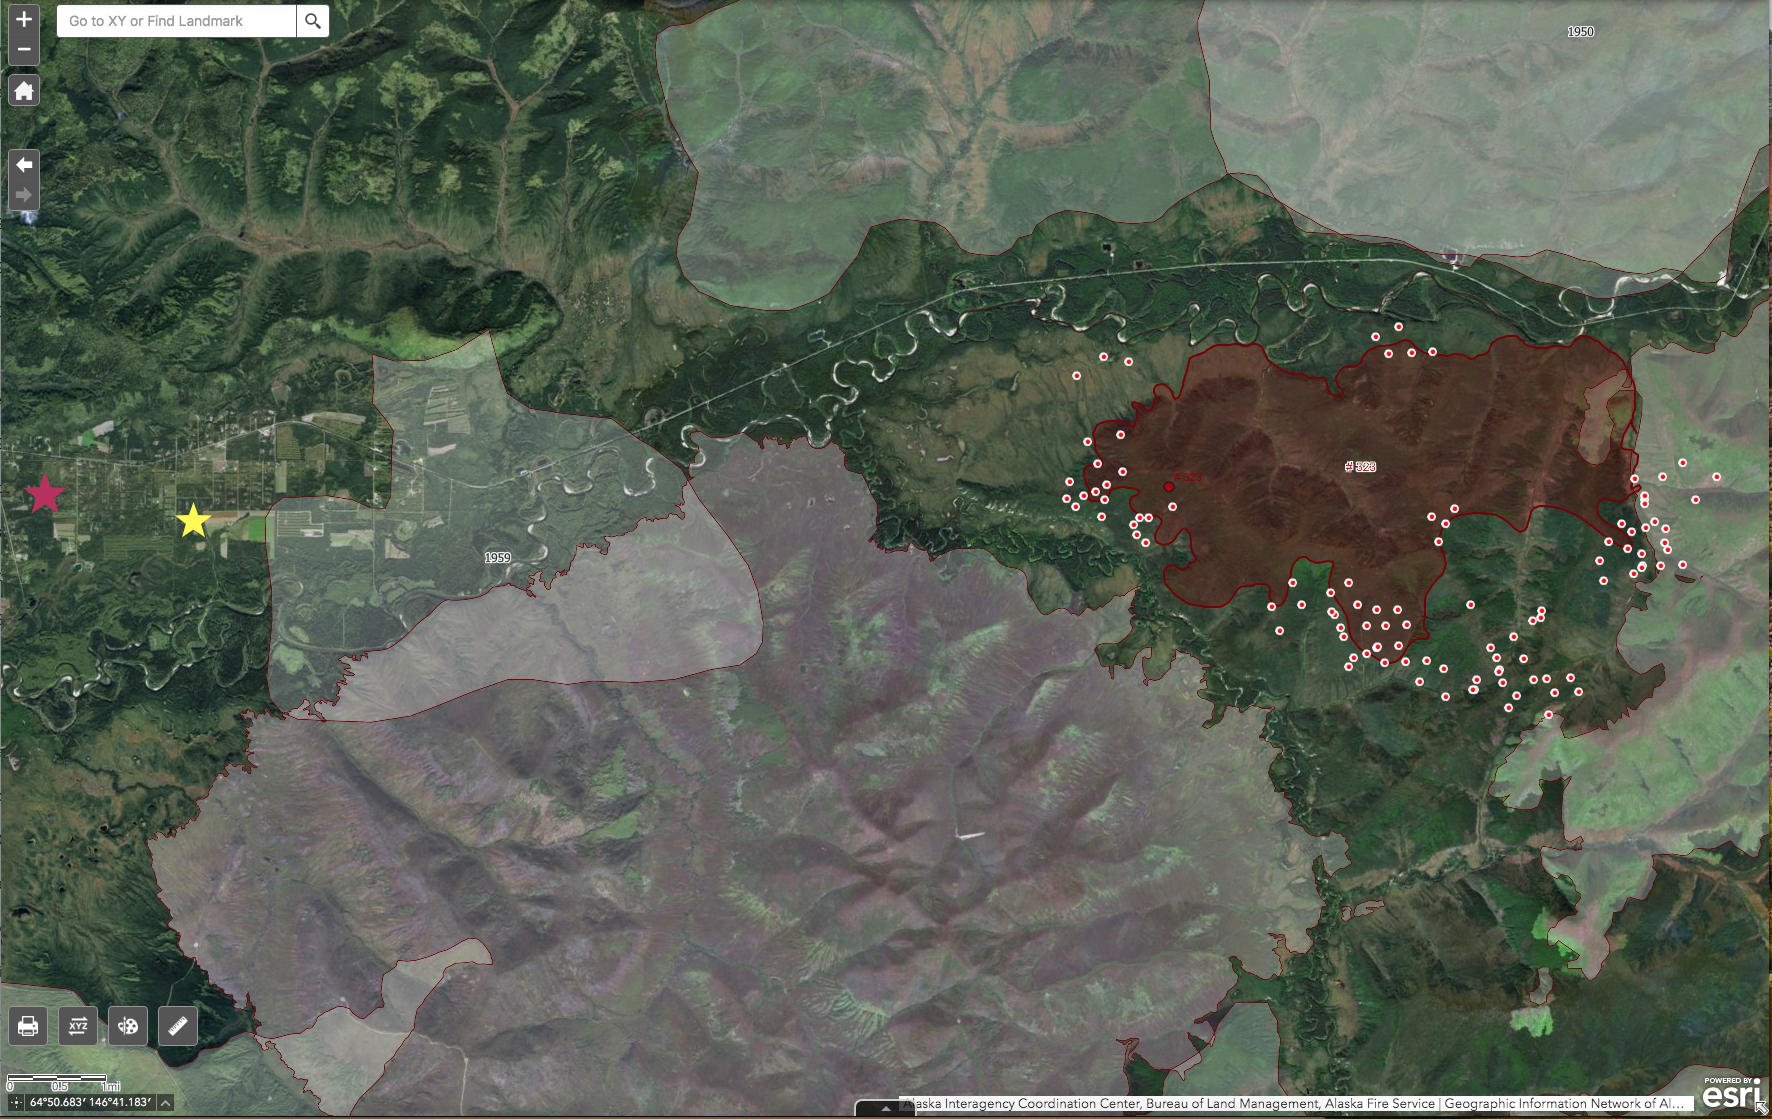
The Nugget Creek fire started in the Chena River State Recreation Area, in a location that is in the “limited management option. Here’s a map of the fire and how it is just nestled into the green, “limited” area. The fire is in red on the right, with the spots indicating where active fire was detected by satellite imagery. The fire has been pretty active on nearly its entire perimeter.

Source: Alaska Fire Service GIS (click for larger image)

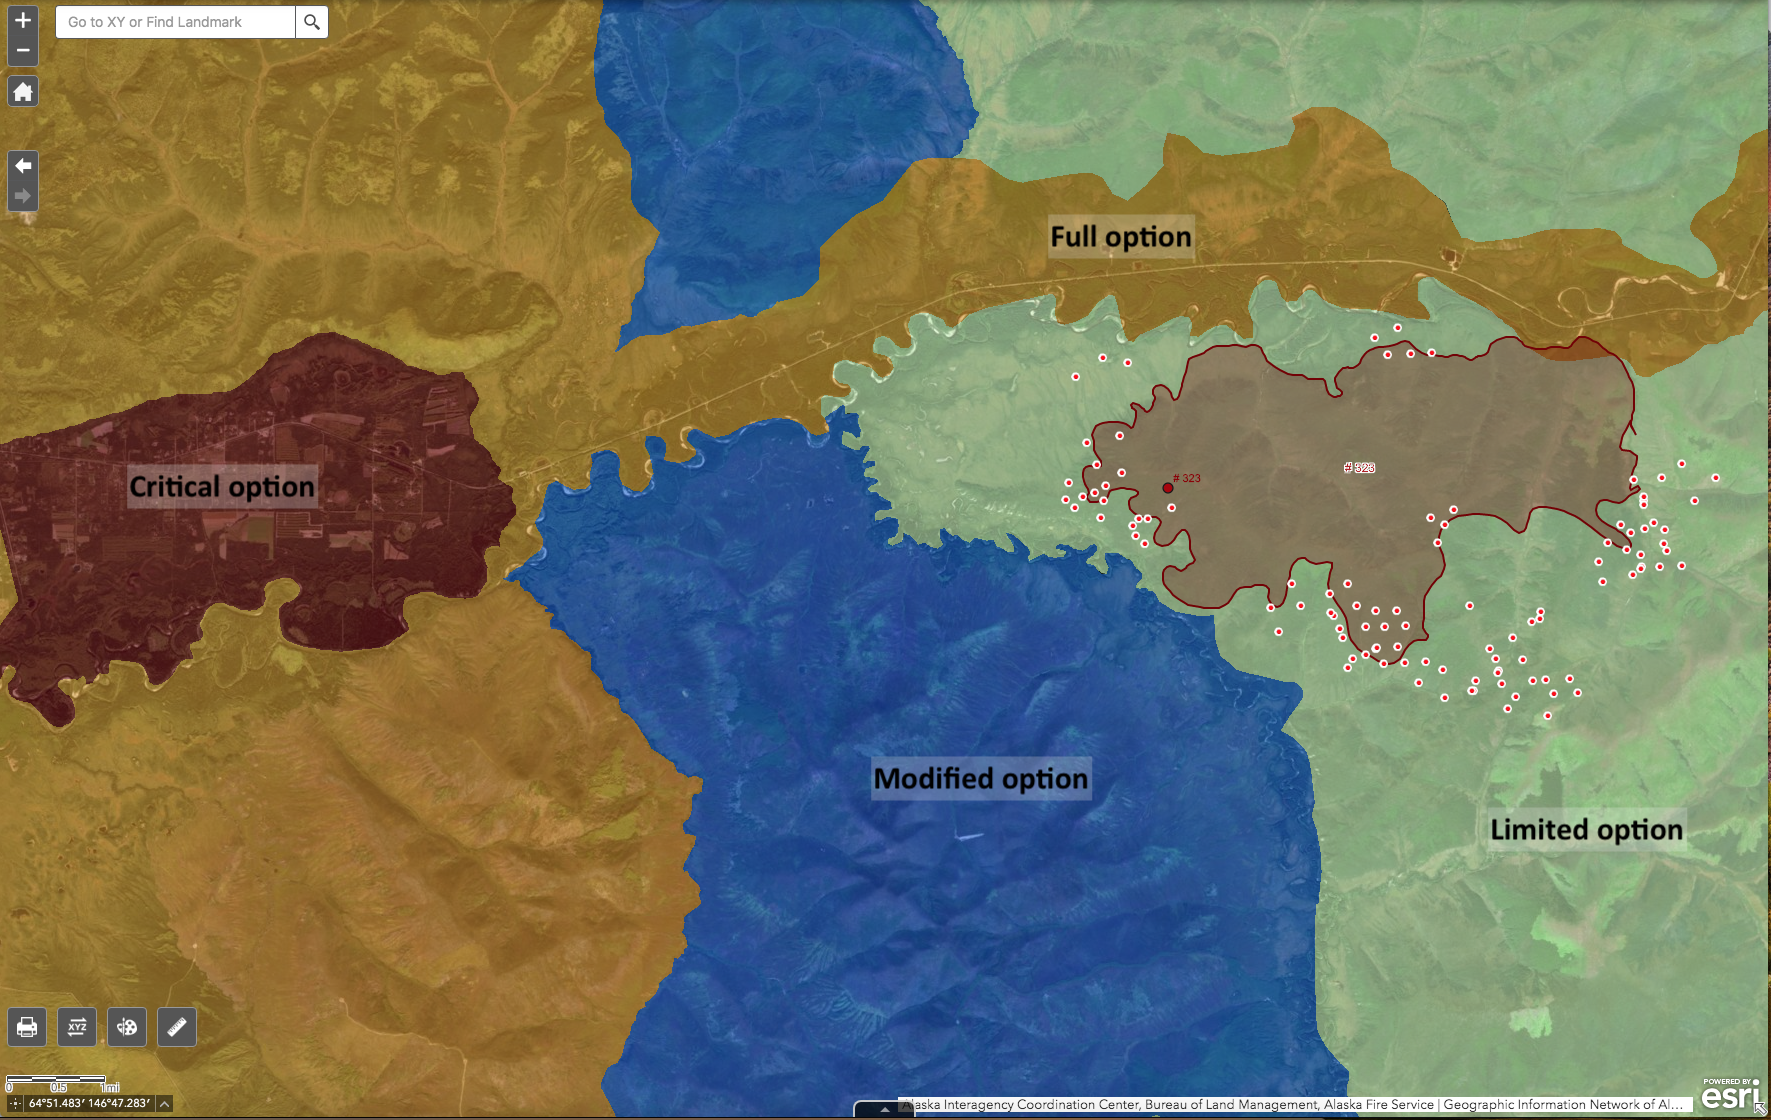
But it is still nearly entirely in the area that belongs to the limited management option. To the north, the full option starts at the Chena River and/or Chena Hot Springs Road, approximately. To the west, the modified option starts at the south fork of the Chena River (the confluence is where green, brown and blue areas meet). There are some fire service staff assigned to the fire, who have been continuously monitoring where the fire is relative to river/road in the north, and also have set up sprinklers to protect a public use cabin on the south fork of the Chena River (Nugget Creek cabin).

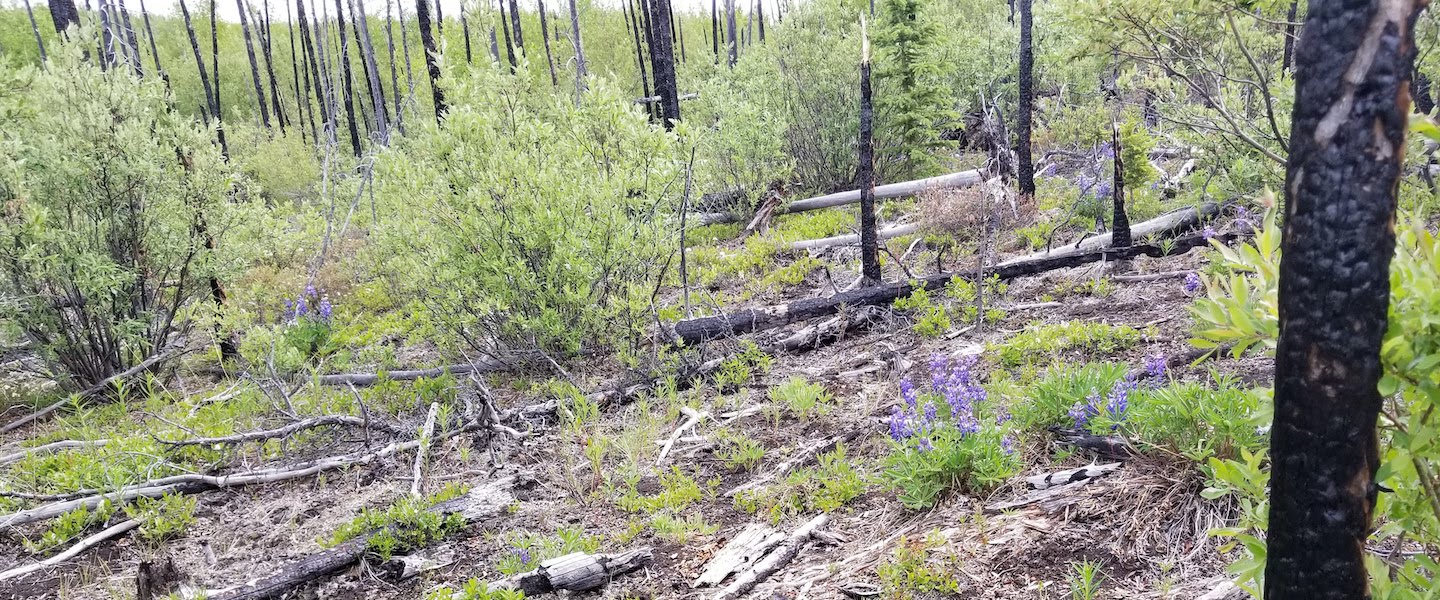
I’m pretty sure that we’ll see some drops of water or retardant if the fire service thinks it may jump over the river or road in the north. There are more reasons to think it won’t spread too far west or east: not only is the western side quite swampy and full of sloughs (and of course a small river), but there are also recent fire scars in the area, which would slow down a fire. The blue area is already within the scar left by the 2013 Stuart Creek 2 fire, and the area east of the fire burned in 2009 or 2000:

Nugget Creek fire as of July 6, with active fire detections around its perimeter. Old fire scars surround the area. The stars indicate where we live, and the location my spouse and I are in the process of moving to. (click for larger image)

So what do I expect will happen? My guess is that the fire will burn out a good part of the triangle between rivers and old fire scars. It’ll be several days before we can expect rain, so smoke will stay terrible for a while.

In any event, Nugget Creek will be an interesting case study for testing models of how fire spreads: It’s one of the few fires that will be relatively easily accessible on foot (once it is completely out of course!), as it has reached Mastodon Creek Trail in the east and is visible from two bridges over the Chena River. And it will have been essentially unsuppressed, ie left ti its natural progression, at least until now.

Fire season in interior Alaska, fire terminology: What is “spotting”?

It is fire season in Alaska and a very smoky Thursday in the Fairbanks area.

Smoke forecast for June 27, 2 pm local time, from the UAF Geophysical Institute. See http://smoke.alaska.edu/PM25.html

The vegetation in the Alaskan Interior (roughly the area between two mountain ranges, the Brooks Range in the north and the Alaska Range in the South) mostly consists of boreal forest – black and white spruce, larch, birch and quaking aspen – with easily burnable undergrowth and a thick organic soil layer in the coniferous parts. This type of forest has long been adapted to a cycle driven into a new round by wildfire. But with climate change, the fire intervals – the time between successive burns, usually over 100 years – have become shorter and areas burned have crept upwards.

Right now, there are many relatively small fires surrounding Fairbanks that are responsible for the smoke. But they are only kept relatively small by the excellent work of our wildfire management services (a complex effort involving both federal and Alaska state agencies, called Alaska Interagency Coordination Center, or AICC). And one of the fires to the north-west of Fairbanks, the Shovel Creek fire, now exceeds 1000 acres (400 ha), is very active, and has put several residential neighborhoods under an evacuation warning. My partner and I live on the east side of town, and the situation there looks about like this now:

Map of fires as of June 26 (evening) in the area east of Fairbanks. Chena Hot Springs Road, along which most people here live, is along the bottom of the map, partly paralleling the Chena River. Fire perimeter (last known) are the red outlines. Recent fire detections are dots in red (last 12/24 hours) or blue (24-48 hours)

Mapping services and data sources available to the general public have become much more widespread, and that’s great. And private citizens, fire management agencies and researchers publish a wealth of photos. But with the flood information comes a challenge: to learn how to interpret it. Because if we don’t, more information can mean more anxiety. Let’s see how we do for the fires in the area where I live.

Last week, we were mostly worried about the Caribou Creek fire (north edge of the map), which is about 7 miles (11 km) due north of our current home. (My spouse and I are in the process of buying and hopefully soon moving to another home very close by, and the fires are clearly making it harder to get the insurance providers to issue the policies we need!) That fire was immediately strongly attacked, and was already in the process of being controlled after received a good dousing with rain last weekend.

As you can see in the map, there is a fire perimeter as well as one red, black-edged dot that indicates the latitude and longitude where the fire was originally thought to have started. But that’s all. However, for the fire east of us (Nugget Creek fire — many fires here are named after the nearest creek, river or sometimes mountain or street), you can also see white-rimmed red dots as well as blue and darker red dots. These are fire detections from satellite observations, and they are more recent than the fire perimeter drawn by the fire services. So by looking where those dots are relative to the known fire perimeter, you can get an impression where the fire is moving. In this case, mostly east and south, plus a little bit north. (The fire is boxed in by rivers west and further north, luckily.) The reason this fire is more active than Caribou Creek is that it is in an uninhabited area (a state recreation park used by hikers etc.) and was NOT initially fought with vigor. And that’s a good thing in principle: it is normal for this forest to burn occasionally. If we never allow it, dead debris is just going to accumulate, and future fires might be that much worse. However, once the nuisance from the fire becomes too great, or the fire approaches areas where it could do damage, the fire agencies will decide to fight it – which is exactly what happened.

Here are some pictures of the Nugget Creek fire from yesterday that illustrate why concern has risen:

This photo was taken yesterday (Wednesday, June 26) evening by UAF’s Dr. Scott Rupp, from his home north of Chena Hot Springs Road and west of the fire. The Nugget Creek fire is on the left. On the right, the Beaver Fire is a new fire burning further south. Used with permission ( original on Twitter: https://twitter.com/TScottRupp/status/1144089781984305153 )
Photo of the Nugget Creek fire from the same day, Wed. June 26, by the Alaska Department of Natural Resources/Division of Forestry. (Author: Brandon Kobayashi). Looking south as well.

The second photo in particular shows that the fire is active along its perimeter, with the smoke being driven backwards, into the already-burned zone (“fire scar”). This is called “backing”.

Backing is one of the terms for fire behavior that it is useful to know. Even more useful, here in the boreal forest of North America, are “torching” and “spotting”, both considered extreme behaviors Torching is a behavior that happens at high intensities in our spruce forests: individual trees, often one after the next, light up in combustion like a torch, with flames rising high and usually a very large amount of smoke. Spotting is another extreme behavior. It means that the fire is driven forward by wind, jumping ahead of the existing fire front by new ignition from falling embers. The fire in the last picture is a highly active fire, but as of the picture neither torching nor spotting. Especially for spotting, you’d have to have wind that blows in the other direction, driving embers ahead of the front.

Why am I harping on words like “spotting”? Because I’ve been seeing a misconception on social media, created by the excellent new fire maps! Let’s zoom in on the map:

Those dots that signify the locations of new satellite-based fire detections? I’ve seen people on social media call this situation “spotting”. But it is not. In fact, when I make fire maps, I prefer depicting the detection as whole footprints, rectangles (or nearly) that indicate what a satellite image pixel looks on the ground. Because the satellite images we use for this are not high resolution: each dot actually covers an area of about (at least) a quarter mile by a quarter mile.

The hobby linguist in me wonders if, given that the public is now used to these near real-time fire detections being available as dots on a map, maybe the term “spotting” will be more and more used in this way. Because it is relevant whether there are new fire detections or not (though to be honest, that’s a lot more complicated than it looks like at fist). “OMG, there are spots of new fire out to the east… the fire is spotting!” To be sure, if the fire is spotting via flying embers, then it is likely that new detections will show up as dots on the next available map. But I do need to point out that spotting, the extreme fire behavior is not the same as new spots on a map. Rather, any movement of the fire, even medium-intensity propagation of the combustion with no spotting at all, will appear as new dots. “Spotting” means a particular way of a high-intensity fire moving ahead, and new fire detections on a map are just new fire detections on a map.

Sources of fire information for Alaska:

  • AK Fire Info. Blog-style, up to date, excellent information about what’s going on, which fires receive what type of attention, planned community meetings, pictures and more.
  • Official BLM/AICC map site. Tip: Use the icons to select the background you like. I prefer “US Topo Map” or “Imagery with labels”.
  • “Old” BLM/AICC map site – harder to navigate, but has also some information the new one hasn’t.
  • UAF Smoke forecasts, run daily based on satellite fire detections and AICC data. Also has a simple “current fires” map.
  • NOAA smoke forecasts for Alaska. May be interesting for people in the Yukon Territory in Canada. Click on the check mark between “near surface smoke” and “loop”.

A map of the Mount Polley Mine tailings pond breach

Like many, I’ve been following the developing story of the large spill of mine tailings and water following the failure of a tailings pond dam at Indurstrial Metal’s Mount Polley mine near Likely, British Columbia, Canada. There has been much impressive video, but I haven’t seen a good map of the lay of the land. So I made a quick one from Landsat imagery.

MountPolley20140805

The before/after comparison shows the same location on the Tuesday before the spill (which happened on Monday, Aug. 4, 2014), and a week later. Debris, which after a day has not yet reached the town of Likely towards which it was headed, is visible in Quesnel Lake (and Polley Lake). Hazeltine Creek, which must have been a small stream passing close to the pond before the breach, is widened and filled with muddy water on a length of several miles (recognizable by the lighter colour). From the numbers I’ve seen, the volume of water:sediments in the spill was about 2:1, so we’re talking about liquid mud. I put in the 1 mi scale by eyeballing it — it’s not precise, but Polley Lake appears to be about 3 miles long.

These images are made from Landsat 8 scenes, which are available freely (simple registration requrired) from USGS (http://earthexplorer.usgs.gov). I did not process them myself, but took the shortcut and downloaded the pre-processed “LandsatLook” images, which USGS provides for illustration purposes (rather than science and image processing). These are JPG files of about 10 MB, which aren’t at full resolution. If I processed the file from the original scene, it would look better, but I didn’t want to download 2 GB of full-scene data and take about an hour to process it myself last night.

Global warming and me, part 2

[Go to part 1.]

I grew up in the 1980s, in Germany. Global warming caused by the burning of fossil fuels was getting attention in the press for the first time in a big way. The reporting was quite lurid — the announced “Klimakatastrophe” certainly was an attention-grabber — but the underlying scientific argument turned out to be simple enough for a teenager to grasp: The temperature of the earth surface is higher than it would be without the presence of certain components of the atmosphere, which cause the greenhouse effect (explanation skipped for the purposes of this post). The most important of these gasses is carbon dioxide. Burning carbon compounds that were buried underground a long time ago (many millions of years), humans add to the carbon dioxide that is naturally present, thereby increasing the greenhouse effect. By enough that the temperature on the earth surface should rise, on the average? Yes.

The next question that an interested mind would ask was “Can we see this temperature rise in measurements?” And back then, after some explanation regarding the difficulty to measure such a thing as a global average temperature, the answer was “Not yet: when we plot the curve, it trends upwards, but is still within the error bars. Come back in a few years.” (Error bars! Cool, I had just learnt about how to handle experimental error and uncertainty in maths and physics class!)

When in the early-mid 90s, I was working in a university lab, some of my friends worked in environmental physics, and their lab was right on the same floor. So I could ask them: what did they personally think? And the answer was unambiguous: Yeah, it’s going up. We expect it to go up theoretically, and it’s experimentally doing just that. They also warned that things would be a lot more messy than just a general warming at each location. We should prepare for more extreme weather — maybe some locations would get wetter or drier or even colder. It didn’t take long for these messages to move from my trusted scientific friends to official reports.

But global warming wasn’t the only or even the primary story about human activities harming the environment in pervasive and important ways that left an impression on my teenage mind. Not even close. Off the top of my head:

  • The ozone hole. Stratospheric ozone depletion over Antarctica was reported by a team of scientists from the British Antarctic Survey, in 1983.
  • Widespread damage to evergreen forests, most noticeably downwind from coal mining regions, dominated the environmental news in 1983 (and for a few years after that) under the keyword “Waldsterben” — the dying of the forests.
  • The Chernobyl nuclear incident happened on 26 April 1986. (I surprised my American/Canadian partner the other day by remembering the date.) It is hard to find a good single overview article on the web other than Wikipedia. For me and my peers this day marked the end of mushroom hunting and wild berry harvesting, and for weeks parents of my school friends checked out our school with Geiger counters.
  • The river Rhine, whose ecosystem was already known as severely damaged by industrial pollution, underwent multiple toxic spills, most prominently the release of large quantities of chemicals after a fire at the Sandoz agrochemical storage plant in November 1986.

I think it is the lessons I drew from how these and other events were handled and played out, then and over the years, that influence my attitudes now. A recent (and excellent) episode of the science podcast published by the journal Nature  looks back at the discovery of the ozone hole. One of the original authors of that first paper can be heard thus: “All of a sudden you look at it differently: Wow, we really can affect the planet as a whole.”

This statement on its own very much captures the main lesson, and it was new at the time. [The final part 3 is scheduled for May 21.]

Global warming and me, part 1

About a week ago, NOAA (the US National Oceanic and Atmospheric Administration) reported news from their longest-running atmospheric measurement station on top of Mauna Loa, Hawai’i: The average daily concentration of carbon dioxide in the atmosphere passed 400 parts per million (ppm) for the first time. This level was already reached a year ago in Barrow on the Alaskan north coast, and it is expected to take a few more years for global averages to rise to this number.

Mauna_Loa_Carbon_Dioxide_Apr2013.svg-1
Graph courtesy Wikipedia. Click to go to article.

The symbolic milestone led me to reflect on the messed-up state of the public debate on global warming and climate change, and its chances of moving into a saner state any time soon. I appreciate that people differ in their political attitudes and preferences about what actions should be taken, which I may agree or (strongly) disagree with. People may also pursue different goals, and that these may be in conflict between individuals. When it comes to discussing matters of fact, however, it should not be impossible to have a common ground on to lay them out and examine them, even if we end up drawing different conclusions or giving different weight to one over the other. Clearly, when it comes to the human impact on the earth’s climate and climate science in general this is very far from being the case.

When dealing with a scientific topic, only few people operate at the level of expertise to have a first-hand informed opinion on the current state of knowledge. Not that few, actually, but few compared to the size of the public as a whole. The rest of us rely on our general scientific background to evaluate what the specialist say, and on translators such as science writers, science educators and researchers from other disciplines to help fill gaps in understanding, link back to more basic knowledge and check that published results pass tests of plausibility. Another tool we use to figure out what factual statement we hold to be true is, I think, to be found in each individual’s biography: We build our mental model of how the world works incrementally. This is the case for judgements (what is important or not, what are the bases of my ethical guidelines etc.) just as much as for facts, and they intermingle. It is in this regard that I wonder about how the experience of the so-called denialists may contrast with mine.

Because it’s pretty much inconceivable to me how, having lived through similar times as myself, someone would end up believing that human activities are not causing changes to the global climate in a way that is worrisome. [Skip to part 2.]